Insights
This tab is available if the Insights collaboration type is enabled and you have the View insights permission.
Evaluate the data collaboration
From the Media DCR Audience Insights, you can assess the potential of the data collaboration with the publisher or data partner and answer key questions:
- Are the insights in line with what I know of the seed audience?
- What is unexpected? Which new findings can I gather about my audience?
- Are the publisher segments rich enough to identify the right target audience in their inventory?
You should come with an open mind, not with specific assumptions, and learn from the data. Expectations can often lead to disappointment, especially when it comes to match rate. For more details, see Beyond match rate.
Important concepts
To properly understand and interpret the Media DCR Audience Insights, you need to grasp two key metrics.
Match rate
The match rate shows the percentage of users in a seed audience that are matched against the users in the base audience provided by the publisher or data partner. The match rate is calculated for both:
- Each audience segment provided by the seed audience provider
- All users (deduplicated)
Formula
- Overlap size: Number of unique matching IDs matched between the seed audience and the base audience
- Seed segment size: Number of users in the seed audience segment
match rate = overlap size / seed segment size
Affinity score
For any segment provided by the base audience provider, an affinity score is calculated inside the DCR. The affinity score shows the over or under-representation of seed audience users in any given segment of the publisher or data partner:
- Affinity score > 1 means that the seed audience is over-represented inside this particular segment of the publisher or data partner. It is a positive affinity.
- Affinity score = 1 means that seed audience has no particular affinity with this segment of the publisher or data partner.
- Affinity score between 0 and 1 means that the seed audience is under-represented inside this particular segment of the publisher or data partner. It is a negative affinity.
Examples: A car brand matches their CRM data as seed audience against the users of a CTV publisher
- The segment "sci-fi" from the CTV publisher shows an affinity score of 3.5, meaning that the car brand customers are particularly fans of sci-fi compared to the average subscriber of the CTV publisher.
- The segment "documentary enthusiasts" shows an affinity score of 0.6, meaning that the car brand customers are watching fewer documentaries on this CTV network than the average subscriber of that network.
Formula
For a given segment X from the base audience provider:
- Overlap size: Total number of unique matching IDs matched between the seed audience and the base audience
- Segment X overlap size: Number of users matched between the seed audience and the base audience that also belong to segment X
- Share in overlap:
segment X overlap size / overlap size - Matchable user size: Total number of users with a matching ID in the base audience
- Segment X matchable user size: Total number of users in segment X with a matching ID in the base audience
- Share in matchable base audience:
segment X matchable user size / matchable user size
affinity score = share in overlap / share in matchable base audience
Insights tab
Several privacy measures are in place:
- Insights are only shown if the overlap between the selected seed audience and the base audience includes at least 100 users.
- A small amount of noise (based on differential privacy), rounding, and suppression is applied to ensure the privacy of the results.
As soon as both seed and base audiences have been provided, the insights statistics are automatically computed. This may take up to several hours, depending on the data size. Insights are shown for a selected seed audience. The insights dashboards show statistics about the selected seed audience in terms of base audience attributes which can be used to inform the design of creatives, select inventory, plan contextual campaigns, and other use cases.
The Insights tab contains multiple sub-tabs. Let's go over each one of them.
Basic
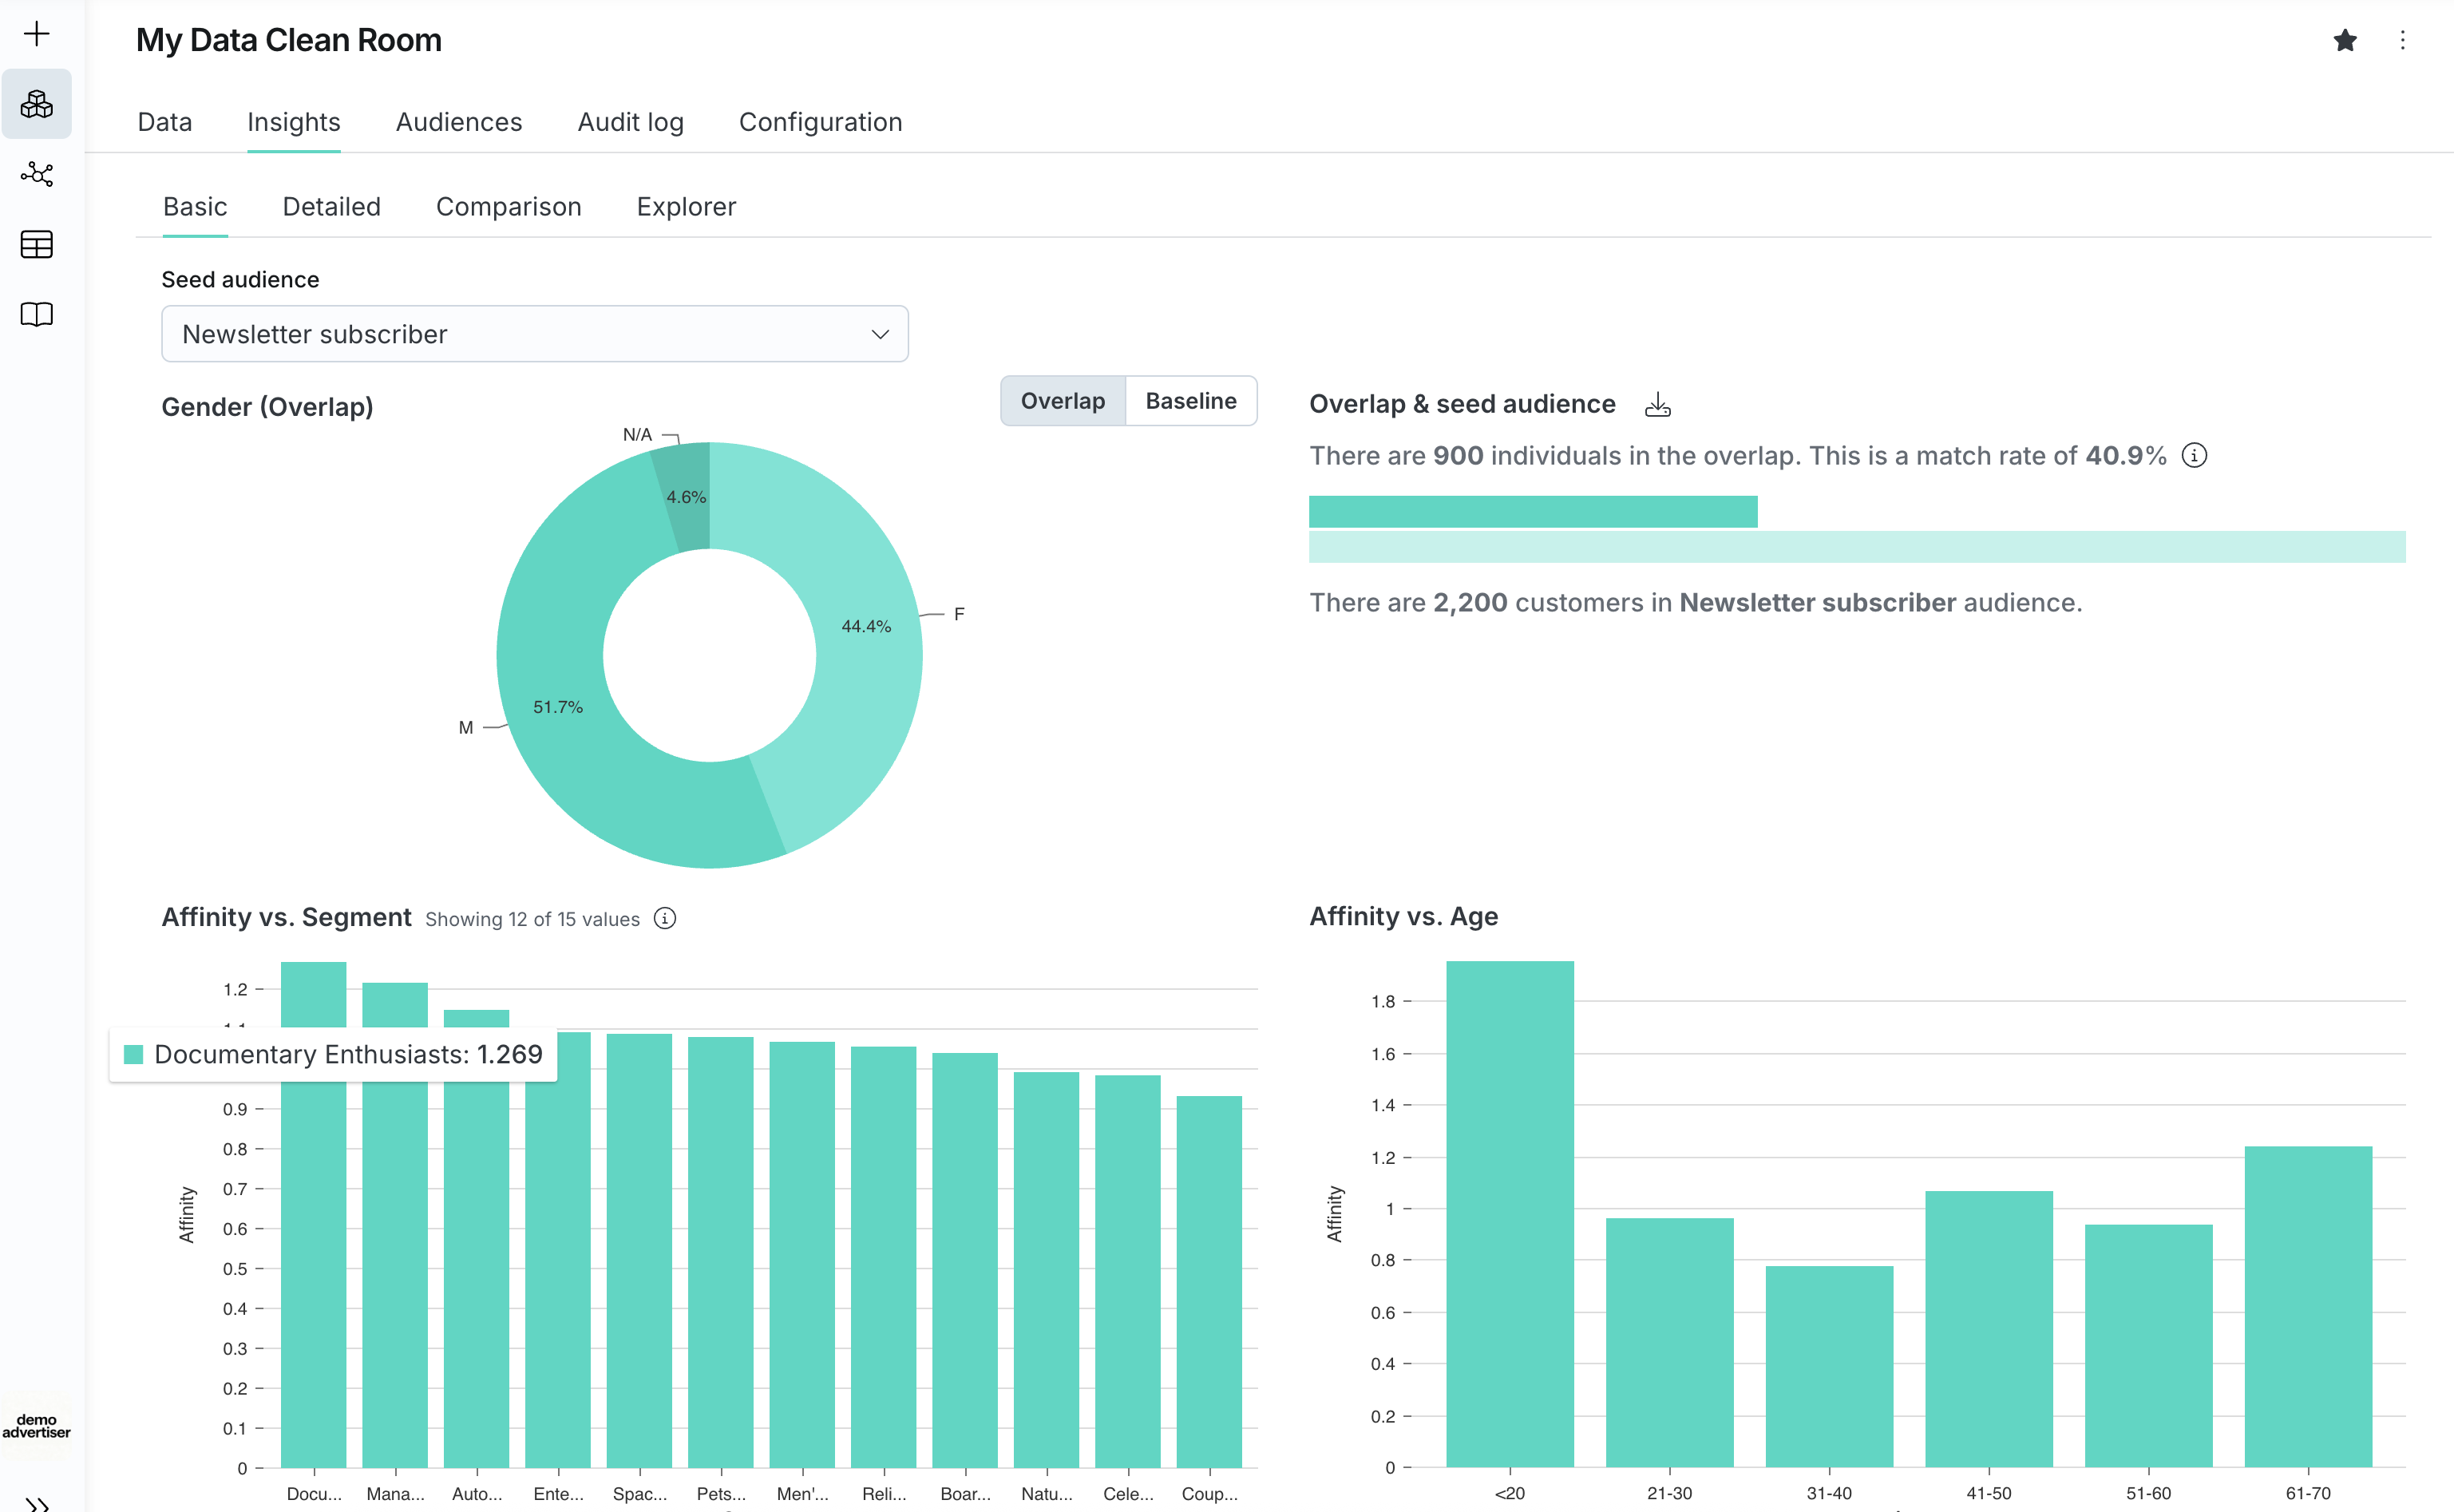
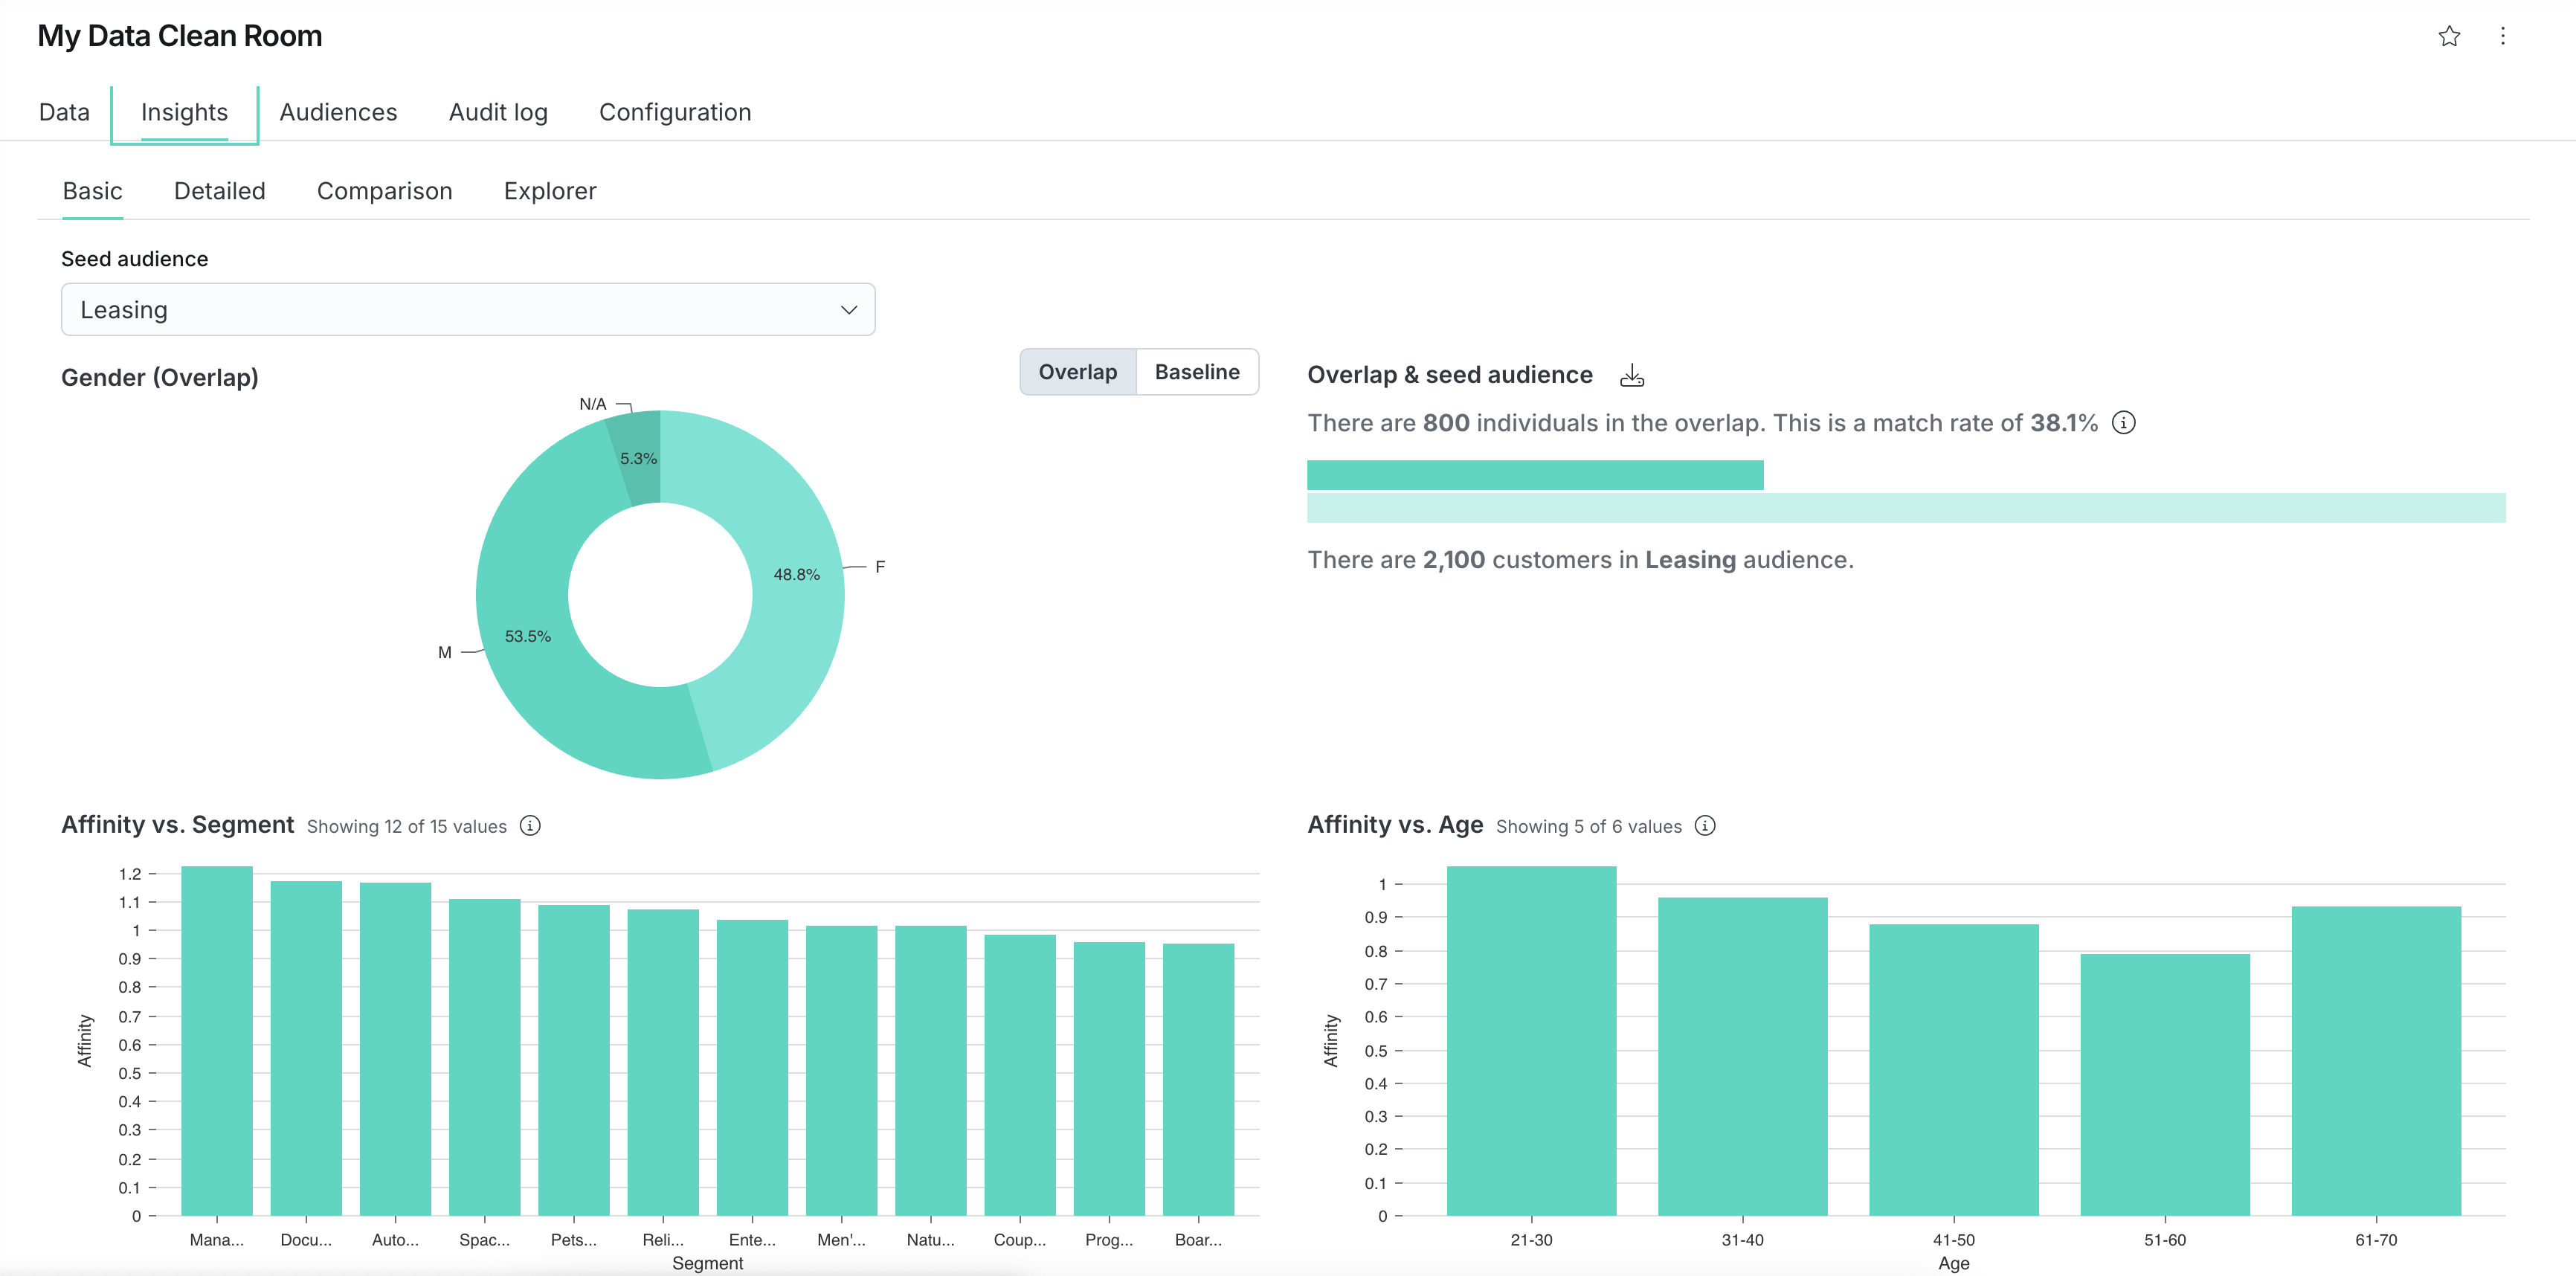
The Basic sub-tab displays 4 main components:
- Top right: A reminder of the audience overlap statistics also available in the Data tab
- Top left: A pie chart showing the gender distribution for overlap versus the baseline, baseline meaning the base audience
- Bottom left: This is probably the most insightful section, it highlights the top 12 base audience segments with the highest affinity scores
- Bottom right: It highlights the affinity score of each age segment
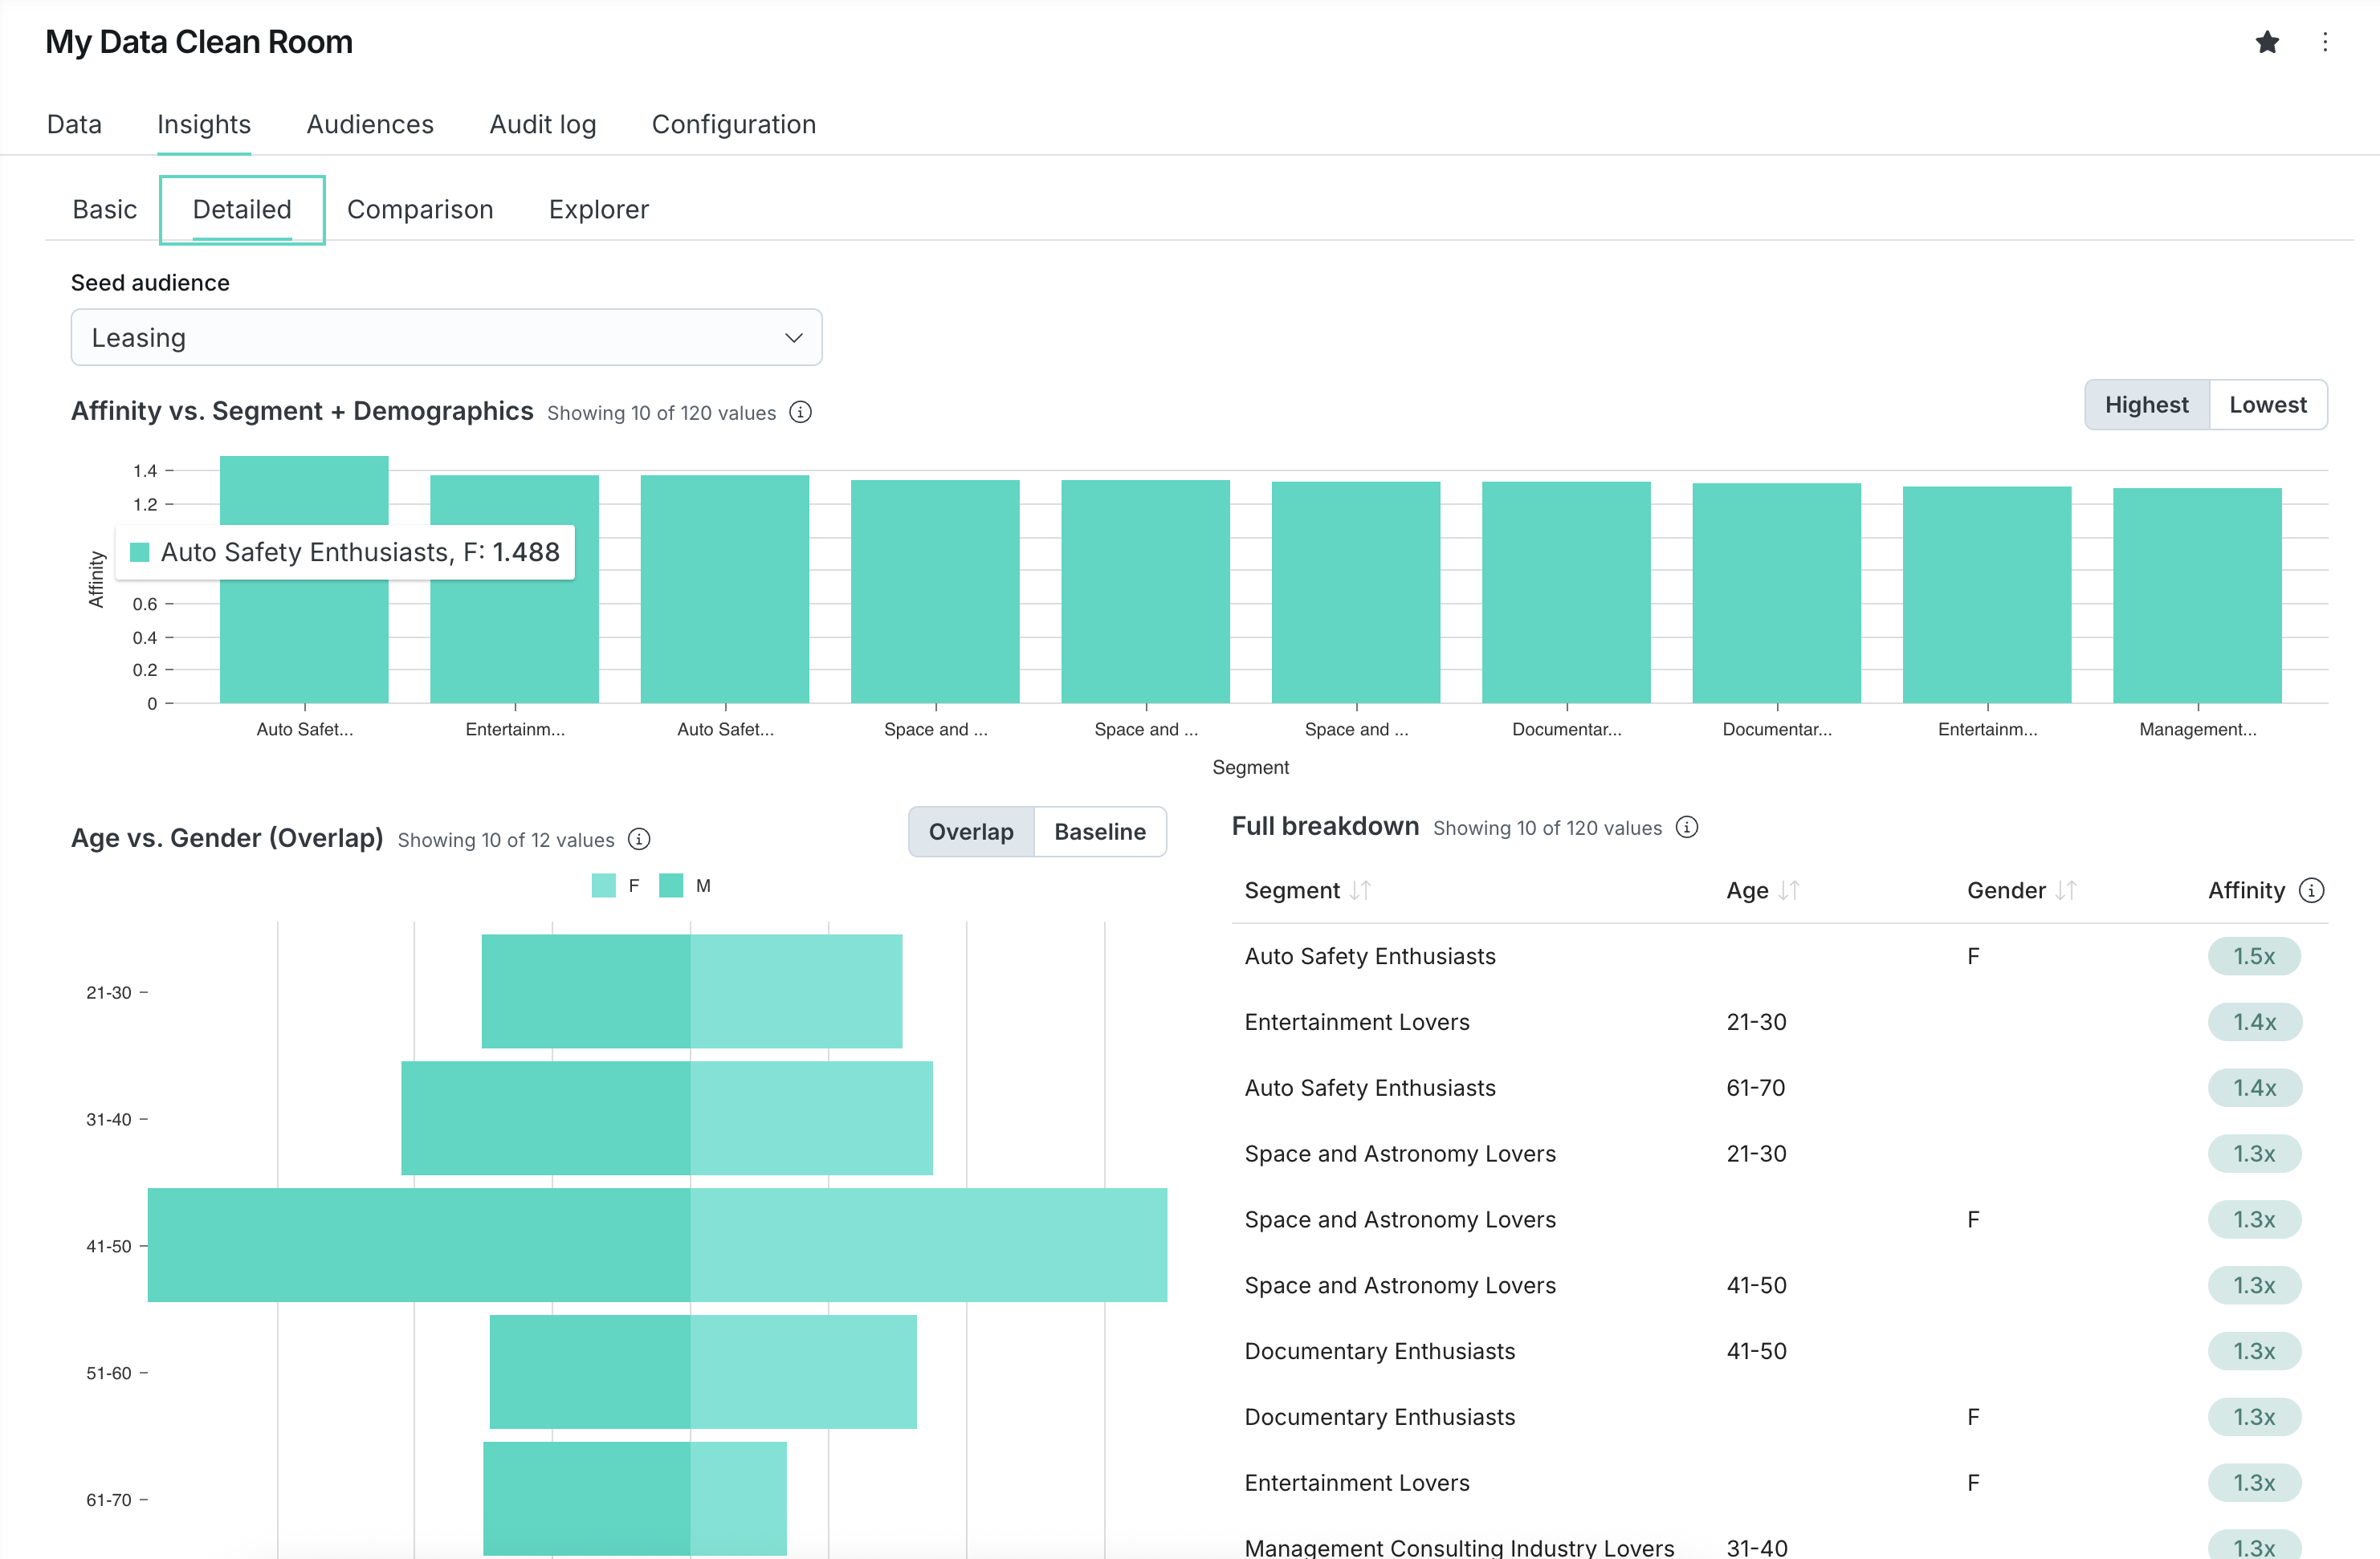
Detailed
The Detailed sub-tab offers the possibility to combine segment and demographic data and therefore highlight the affinity for any given segment/age/gender combination.
You can change the view to look at the highest or the lowest scores as well as toggle between the overlap and the baseline audience, to understand over or under-representation.
In the screenshot below, you can see that within the "Leasing" seed segment, Female users in the "Auto Safety Enthusiasts" segment show an affinity score of 1.488, which provides additional indications on who to potentially target.
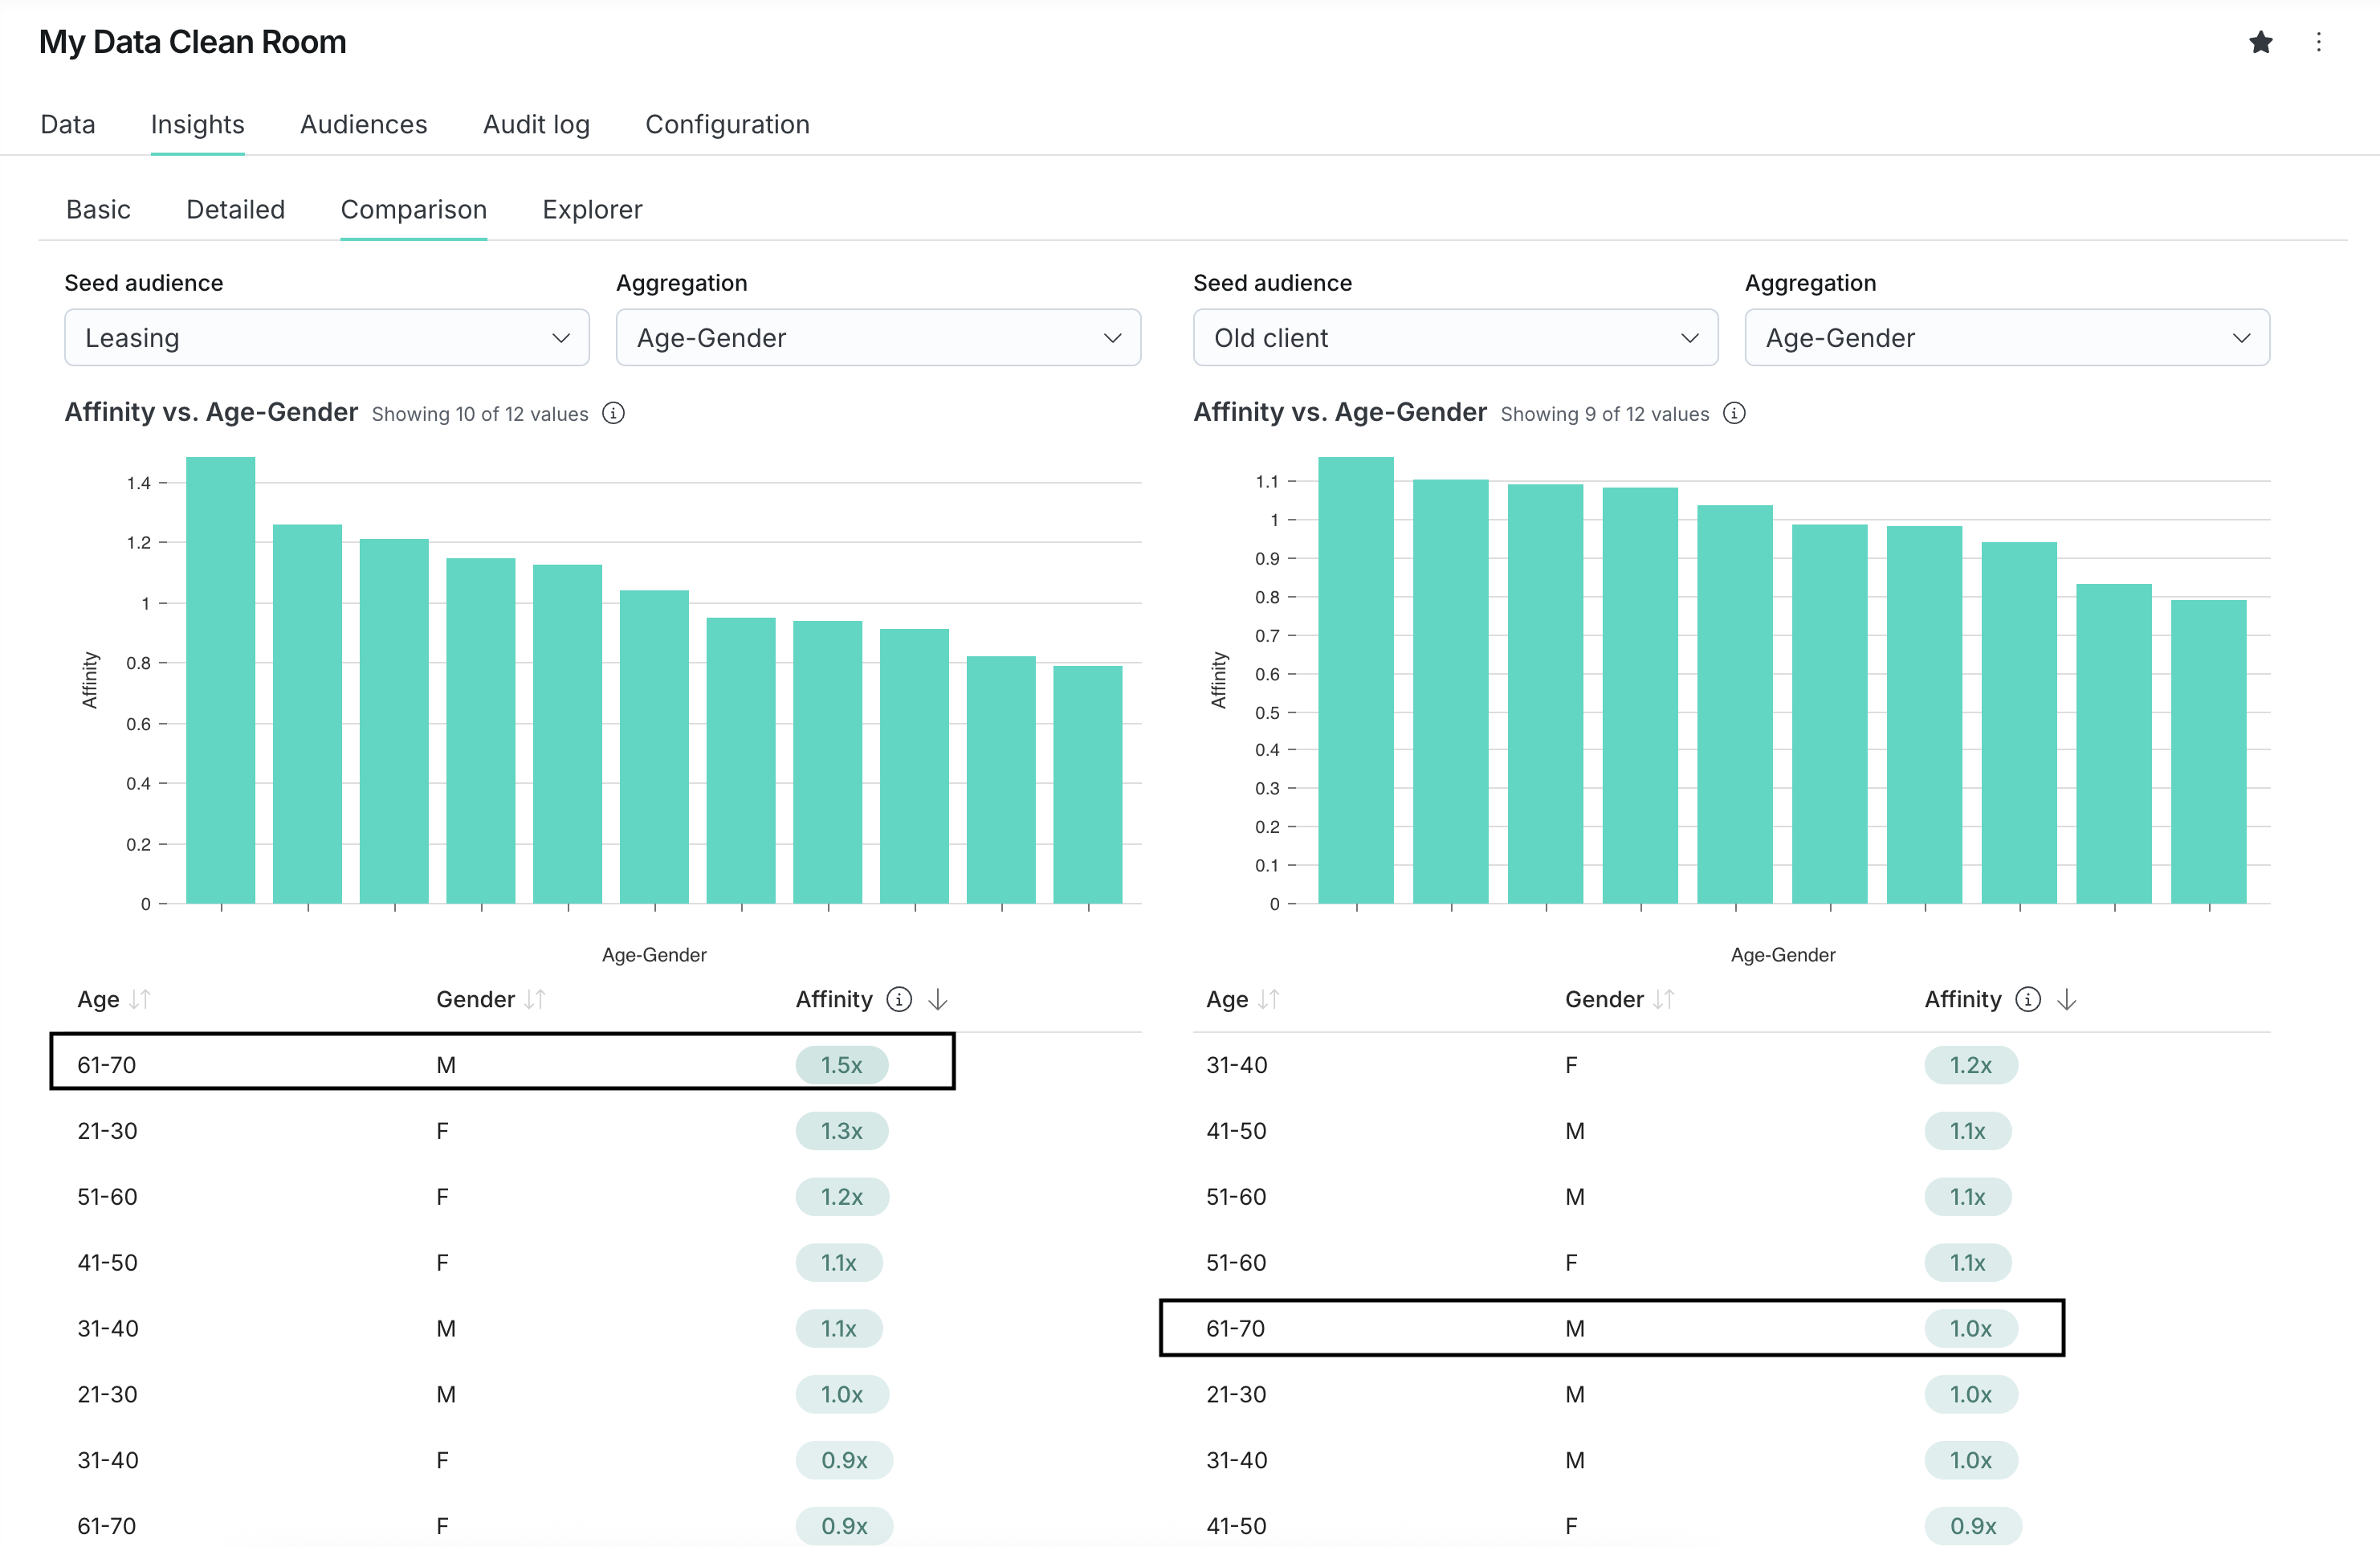
Comparison
You can compare 2 different seed audience segments against each other.
In the screenshot below, you can see that when comparing two different seed segments ("Leasing" segment and "Old client" segment), the Male cohort of 61-70 is over-represented amongst the "Leasing" users but not showing any over-representation amongst the "Old client".
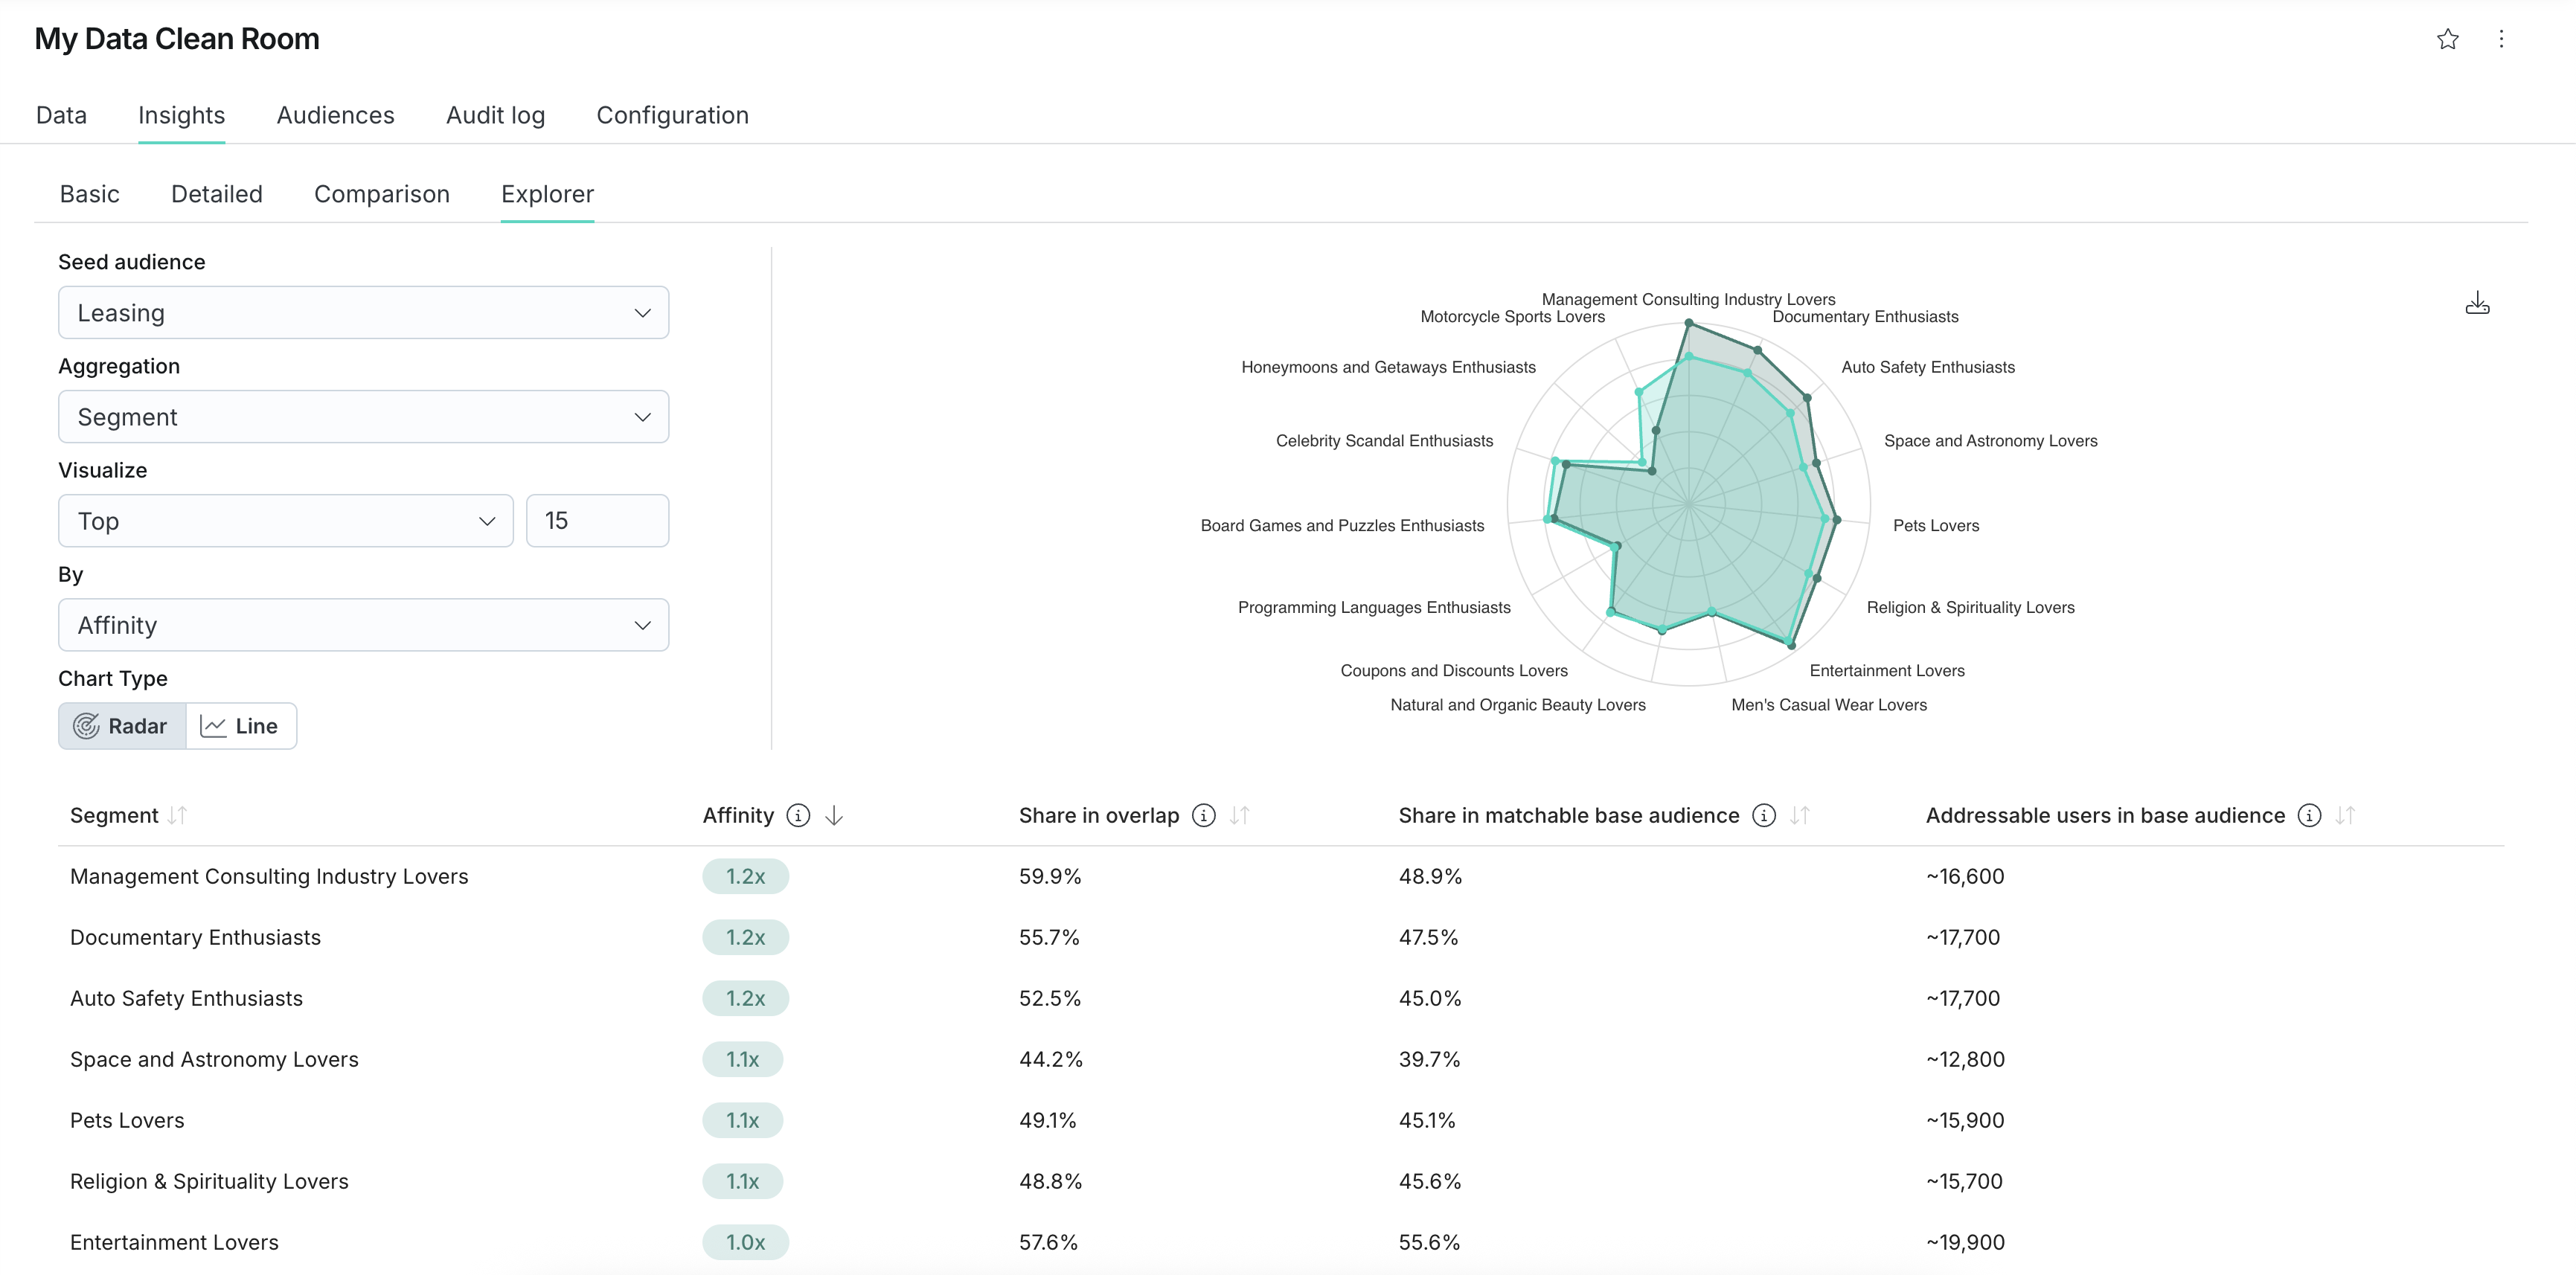
Explorer
The Explorer sub-tab provides the most granular view as it displays all segments from the base providers ranked by highest or lowest affinity scores. It also displays the total addressable users for any segment, which is key when deciding to select or suppress a segment in a media plan.
All insights can be exported from the Explorer tab by clicking on the download button in the top-right corner.
Protecting user privacy
Privacy safeguards are implemented to protect user privacy and reduce risk of user re-identification.
- Insights (e.g. match rates, affinity score) are not displayed for any overlap that is less than 50 users.
- Example: If the seed audience and a base audience segment overlap size is 43, there will be no affinity score displayed for that base audience segment.
- Audience sizes are rounded to the closest 100.
- Example: True audience size of 14,553 will be displayed as 14,600.
- Audience overlap are rounded to the closest 100 if greater than 100, otherwise to the closest 10.
- Example: True overlap of 53 will be displayed as 50, and 132 will be displayed as 100.
- Audience insights (e.g. addressable audience size, affinity score) are slightly modified with noise (positive or negative noise) to protect against privacy attacks. Decentriq is leveraging differential privacy algorithm to compute the right amount of noise to be added or removed from the insights displayed.
- Example: True addressable audience size for the segment “Tennis lover” is 145,500 but the dashboard will display instead 144,700 after applying the noise.
Best practices
Do's
Evaluate affinity scores in relative terms, not absolute terms
An affinity score for a given segment has no inherent value on its own. It becomes meaningful only when compared across affinity segments within the same Media DCR (for example, segment X has a score of 2 versus segment Y has a score of 0.5). The larger the differences between the affinity segments inside a given Media DCR, the better it is to qualify the audience. As a result, steeper histograms indicate better qualification power (better discriminatory power in statistical terms).
- Segments with the highest affinity scores (for example, top 5 or 10) should be analyzed to determine if they are trivial, unexpected, or reveal behaviors relevant to the business.
- The same analysis should be applied to segments with the lowest affinity scores. These show negative correlation—interest groups the seed audiences don't belong to.
- Segments with much higher or lower scores than others can be outliers due to a very small segment size.
Validate the quality of the partner data
If you are confident about the seed audience (for example, predominantly young women), then the affinity scores should be high for the corresponding demographics and segment scores. If not, the partner data may not be accurate.
Focus on the demographics insights
Demographics should be examined to identify which groups show higher engagement and where expansion opportunities exist. Comparing age and gender across audiences helps identify primary target groups and potential growth areas.
Compare different seed audience segments
Affinity scores can be compared across different seed audiences, revealing clear differences in terms of demographics and interests. This can be very valuable when comparing buyers of two different products of the same brand.
Don'ts
Match rate should not be the sole success metric
Match rate isn't inherently meaningful. Small match rates can yield strong results. Small niche audiences often indicate higher potential in niche markets that provide the highest ROI. See Beyond match rate for more details.
Affinity scores should not be compared across publishers or data partners
Each partner has unique data that isn't comparable in terms of affinity scores. Even demographics can be classified differently based on collection methods.
Avoid focusing on super high affinity scores linked to small segments
As explained before, small base audience segments can be linked to very high affinity scores. These are statistical outliers that should be ignored.
Avoid comparing base segments across publishers or data partners
The base segment "sports" from publisher A and publisher B may be defined very differently. Each publisher or data partner uses a proprietary method to segment the first-party data, so the same segment name may hide very different segment definitions.
Practical applications
First-party data has the highest value and is closest to the actual users, providing unique insights if used properly. These insights can be best leveraged for:
- Demographic analysis: Who are the buyers, how old are they, what gender do they have?
- Persona building: Create marketing personas with demographics, interests, purchase intents, and consumption behaviors that can support the whole marketing department. See case study.
- Media creative optimization: Select the creative that aligns best with the customer profile and marketing personas.
- Better plan the next media campaign: Apply learnings to get the most effective campaign on the publishers of choice, include high affinity segments or suppress low affinity ones. See case study.